operations · 2026-09-26 · 13 min read
The nightly that never got past step one, and a log portal that couldn't have told me
Why this exists
The first ten articles in this series were about getting fifteen years of CRM history out of a legacy system and into a searchable index. They were written from a terminal, and a terminal is a generous place. It has your settings loaded, your permissions, your working directory, and you, watching.
The index is only useful if it stays current. New tickets arrive every day, so the pipeline has to run every night on the GPU machine at the customer's site, with nobody watching. This article is about what changes when you take the person away. Almost everything that went wrong was invisible from a terminal, because it depended on something a terminal quietly provides.
It's also about the log portal, because that's where I'd have expected to see the problems. For most of them I couldn't.
First, where the logs go
A log line is a sentence a program writes about what it's doing. On a single machine you can read them in a file. This installation spans two hosts, the GPU machine running the models and the search database, and an application server running replai itself, so every line has to travel to one place before anyone can search it.

A small collector on each host reads every container's output, scrubs anything that looks like an address or a name (the rules are an earlier article), and sends it through an SSH tunnel to a store called VictoriaLogs. The store keeps thirty days or four gigabytes, whichever comes first.
The log portal is the store's own search page. It listens only on the server itself, not on the network, and it has no login. That sounds careless until you read the reason in the configuration: there's no login because there's nothing exposed to log in to. To use it, I open a second SSH tunnel from my laptop, and the page appears as if it were running locally.
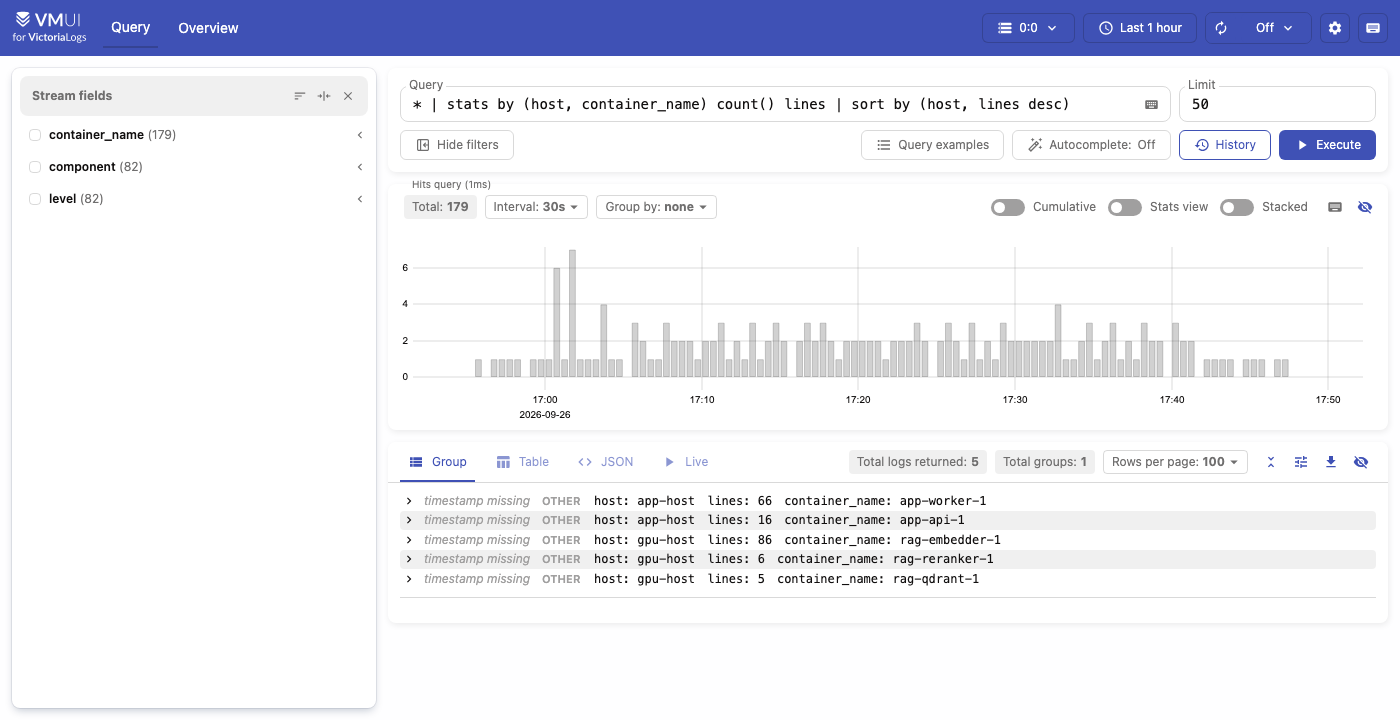
Dull question. It's dull because the answer used to be no.
The lines that arrived without their times
Until 2 September, only one collector existed, on the application server. It read the containers on its machine. When the deployment split across two hosts, the model servers on the GPU machine kept their logs in Docker's local files, three files deep, until they aged out. Nothing reported that. An empty search looks exactly like a quiet night.
And the lines that had reached the store before the split were damaged in a
way that's almost funny. The model server, llama.cpp, starts every line with
its own uptime, like 0.01.640.725. Four groups of digits separated by dots.
My scrubber's rule for IP addresses saw four groups of digits separated by
dots and replaced it. Every line from the first thousand seconds of each
server's life arrived with its timestamp redacted as an IP address, which is
exactly the window where the model loads and says how many request slots it
has. After a thousand seconds the first group grows to four digits, the rule
stops matching, and the damage stops, which is why it hid so well.
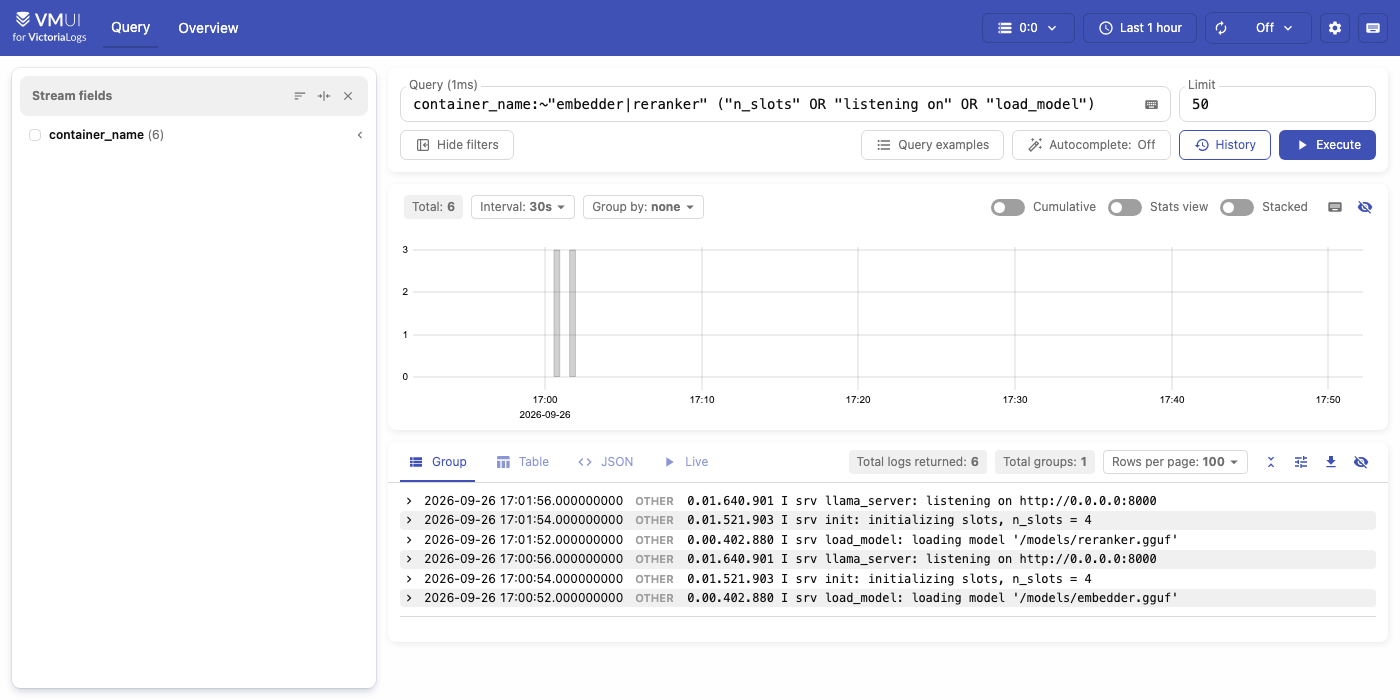
The fix limits each number in an address to 0 to 255, which the uptime prefix never satisfies. Before it, 44.7% of the embedder's lines in the store carried the marker. Then the second collector went onto the GPU machine, and the lines had somewhere to go.
Step one: a health check that says yes to everything
A model server like llama.cpp handles four requests at a time. Think of it as four checkout counters. Every server also answers a health check, a tiny "are you alive?" request, and llama.cpp answers yes whenever the process is running.
At the customer site, a run from the previous night hadn't finished. It sat holding all four counters. Every fresh run then waited for a counter until it gave up after 300 seconds, and the health check kept saying yes, because the server was alive. One run was found still retrying sixteen hours after it started.
The nightly script got four guards, and each one, in the script's own words, exists because its absence cost a real afternoon at a customer site. A lock, so a second run leaves instead of queueing behind the first. It's the kind of lock the operating system removes when its owner dies, so a crash can't leave it stuck. A deadline of eight hours per stage, after which the stage is stopped. A preflight that sends one real embedding request before anything else happens, because the only honest test of "can I do work" is doing some. And quiet success, because cron e-mails whatever a job prints.
Keep that last one in mind. It comes back.
The application side learned the same lesson the same evening. Its model health checks now send a real request too, and the commit says where the idea came from.
Step two: the reboot at three in the morning
The GPU machine restarted one night. Nothing came back up. Every nightly run after that failed its preflight, correctly and uselessly, until a person happened to notice.
Two separate fixes were needed, because each covers a case the other can't. Docker's restart policy brings back containers that exist when the machine reboots. It can't recreate one that somebody removed. So there's also a small system service that starts the whole stack from nothing at boot, waits for a real embedding request to succeed (up to seven minutes, because the first start downloads about 600 MB of model weights), and retries three times.
Then permissions. That service runs as root, on purpose, and here's why.
Controlling Docker is effectively root access, so it's limited to members of a
docker group. The account on that machine isn't in it. Every Docker command
therefore goes through sudo, and sudo asks for a password. At boot there's
no keyboard and no terminal to type into. A service running as that account
would have sat at an invisible password prompt until it timed out. Running it
as root is the honest version of what the account would need anyway. The
nightly data job, by contrast, gets Docker access only if you explicitly ask
for it with a flag, because a job that reads tickets has no business holding
the keys to every container on the machine.
One more from the same commit. A missing setting for the embedder's address used to produce a 300-second timeout, not an error saying which name was wrong, because the pipeline sat waiting on an address that nothing answered. The model servers now have a fixed name on the internal network, so the default is right.
Step three: too many open files
When the search index grew from two filtered fields to nine, creating it on a fresh database failed with this.
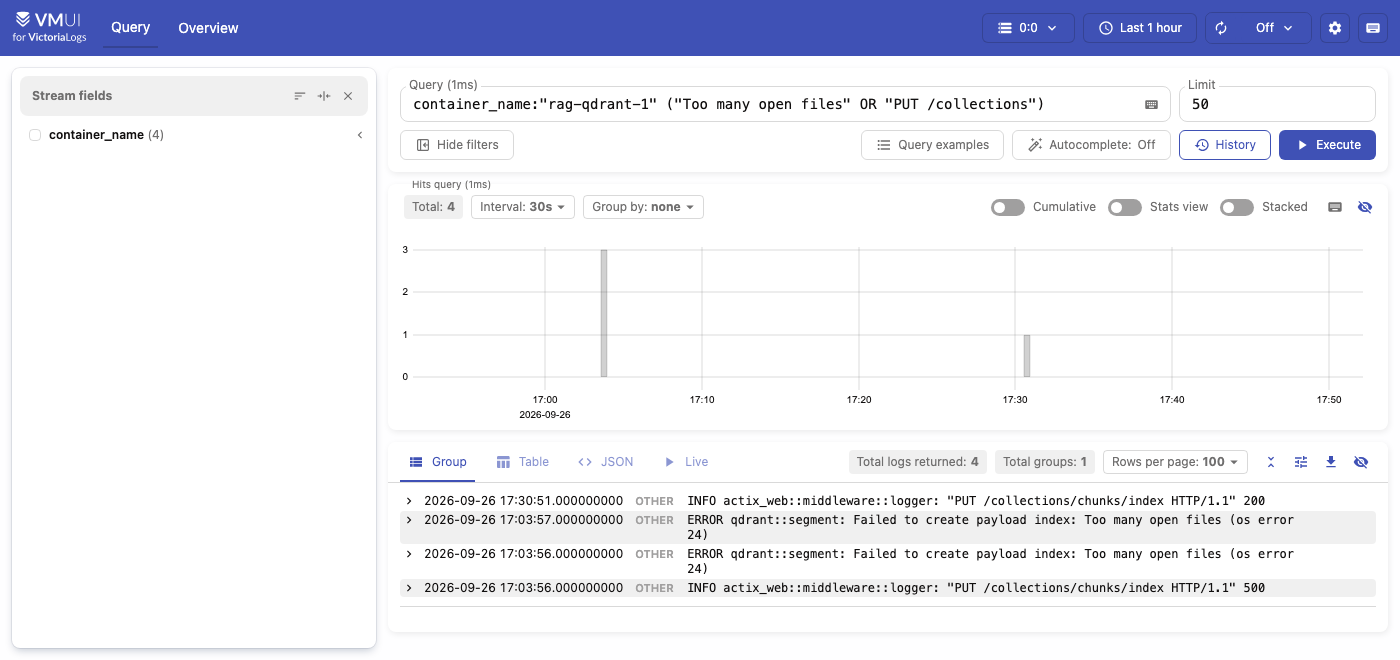
Every program has a limit on how many files it may hold open at once. Docker's default is 1,024. The vector database opens a small internal store per filtered field per segment of data, and nine fields across many segments went straight through that limit before a single vector was written.
The obvious fix is to raise the limit for all of Docker. That means restarting Docker, and on this machine that would also have restarted the e-mail assistant's containers running next door. So only this one container's limit moved, to 65,536, the floor the database's own documentation asks for.
Step four: cron gives you nothing
Now the one that cost the most, and the last to be found.
Cron is the operating system's alarm clock. At the set time it starts a program, and it gives that program almost nothing: a minimal set of paths, the home folder as the working directory, no terminal, and no settings. The settings a program reads from its surroundings are called environment variables, and your terminal has dozens. Cron has almost none. That's why "it works when I run it by hand" proves nothing about cron.

The pipeline script checks that three service addresses are set, as environment variables. Cron sets none of them. So every night the job fetched new tickets from the CRM, fetched their attachments, passed its preflight, and then the pipeline step refused to start and exited with code 2, before touching the search index. The index never changed after its first run.
How did the preflight pass? It reads the settings through the application's own settings loader, which reads the configuration file directly. The script it was guarding reads only the environment. Both were correct about what they read. A check that reads its configuration differently from the thing it checks will pass for the wrong reason, every time, and look like diligence while doing it.
The fix makes the script ask the same settings loader and export the three
addresses. It deliberately doesn't just load the configuration file into the
shell, which is the one-line fix everyone reaches for, because the shell would
eat the backslash in the CRM login name (DOMAIN\ACCOUNT), and the fetch would
then fail on a login that was always correct. Fixing one invisible failure by
creating another would have been very on brand for this series.
A second bug turned up behind the first, once the pipeline actually ran. The step that writes vectors skipped any ticket whose source hadn't changed. But the model enrichment step can improve a ticket's text without the source changing, so enriched tickets kept their old text and old vectors forever. Each stored entry now carries a fingerprint of the exact text it was built from. The first run after the fix rewrites the whole index once, about twenty minutes of embedding, and after that only what changed.
Both fixes are on a branch, not yet merged.
What's still wrong
Three things, written down because they're true.
Quiet success isn't delivered. The script's header promises it. The code copies every stage's output to the screen as well as to a file, so cron still mails the whole transcript unless the cron entry throws the output away. A review from the application side caught that, and it's still open.
The pipeline's own logs never reach the portal. The job runs directly on the host, not in a container, so the collector never sees it. Its output lives in a folder per run, plus a small status file. That's how a job could refuse night after night while the portal showed healthy, busy servers. The servers were healthy. The job that uses them just never asked them anything.
Silence has no detector. The designed check, "zero lines from the GPU host in the last hour means the tunnel is dead", is written in the design notes and not built. The portal is very good at showing what arrived. It can't show you what didn't.
What I'd take from it
Readiness is the work itself. A health check that doesn't do a real request measures whether the process exists, which is rarely the question.
Checks have to read their inputs like the thing they protect. Otherwise they check something else.
Comments and headers are strong evidence about what happened and weak evidence about what the code does now. "Quiet success" was a sincere promise and an untrue statement at the same time.
And design for the person who isn't there. Every failure in this article was obvious to someone at a keyboard and invisible to everyone else, which, for a firm with no IT department, is everyone.
Written with AI from my own repositories and notes, reviewed and published by me. How this site is written