logging · 2026-09-26 · 10 min read
A log viewer for a job nobody watches, built from the standard library
Why this exists
This article belongs to the first part of the series, the pipeline, even though it was written last. It closes a gap the pipeline had from the start.
The pipeline runs every night on the GPU machine at the customer's site, started by cron. As the nightly article explains, its output never reaches the central log portal. The portal collects what containers print, and the nightly job isn't a container. Its record of what happened was a folder of files per run, plus whatever cron mailed to a local account.
So to answer the simplest question anyone could ask, what did last night's run do?, somebody had to open an SSH session, find the right folder, and read several text files in the right order. For a firm with no IT department that means nobody asks. And a job that refuses night after night, which is what happened, is exactly the job that needs someone to ask.
This is the tool I built so the question takes one click. It's small, and most of what's interesting about it is what it deliberately doesn't do.
Step one: one file per day that everything writes to
A nightly run isn't one program. It's the nightly script, then the connector that pulls from the CRM, then eight pipeline steps, each its own process, started by a wrapper script. Before, each of them logged to its own place, and none of them shared a way of saying which run they belonged to.
Now every one of them appends to the same file, pipeline-2026-09-26.jsonl,
one file per calendar day (UTC). Each line is one event, written as JSON
so a program can read it back. And every line carries the same
four labels: the run it belongs to, which program wrote it, which pipeline step,
and the process id.

The obvious tool here is Python's rotating log handler, and it's wrong for this case. It renames the file when it rolls over to a new one. With several processes writing at once, two of them can roll over at the same moment and rename files underneath each other. A file whose name is its date never has to be renamed. Every writer works out the name from the event's own timestamp and appends.
Appending is the other half. Each line goes to the file in a single write, to a file opened in append mode, which on a local disk places it atomically at the end. So when two processes write at the same instant, their lines interleave as whole lines, never as two halves glued together.
Old files are deleted after thirty days, judged by the date in the name, whenever a process opens the log. Nothing has to be scheduled for that. And if the host stops running the pipeline, it stops deleting too, which is the right way round: the last month of logs before something went quiet is exactly what someone will want to read.
And logging is never allowed to break a run. A full disk or a folder without write permission produces one warning, then silence, and the run carries on. The bash scripts get the same behaviour from a small helper that writes the JSON by hand, because the only thing worse than a failed nightly is a nightly that failed because it couldn't write down that it was fine.
Step two: a server you start, and that stops by itself
The viewer is a small web page served by the pipeline itself:
python -m pipeline logs # http://127.0.0.1:8765/It uses only Python's standard library. That's a hard requirement here, since the customer's machine has no internet access and the pipeline's environment carries exactly one dependency. The page is plain HTML, CSS and one JavaScript file, with no framework and nothing loaded from outside. About 2,500 lines in all.
It isn't meant to run all the time. You start it when you want to read logs, and it stops on Ctrl+C, or by itself after thirty minutes without a request, so a forgotten viewer doesn't sit on a port for weeks.
It has no login, so the network boundary is the access control. It listens
only on the machine itself (127.0.0.1), and from a laptop you reach it
through an SSH tunnel, which the command prints for you. Two more guards,
because "only on this machine" is weaker than it sounds once a browser is
involved. A malicious web page can point its own domain name at 127.0.0.1
and then read responses from a local server as if they were its own, a trick
called DNS rebinding. It can't, though, make the browser claim to be talking
to 127.0.0.1:8765. So the server checks that header and refuses everything
else. And every route is read-only. Nothing in it writes, deletes or runs
anything.
Reading stays cheap because the files only ever grow. On each refresh the viewer reads just the bytes a file gained since last time. Thirty days of nightly runs is on the order of a hundred thousand lines, which fits in memory and filters in tens of milliseconds. It needs no database and no index.
Step three: runs, not lines
A log file is a list of lines. What a person actually wants to know is a list of nights.
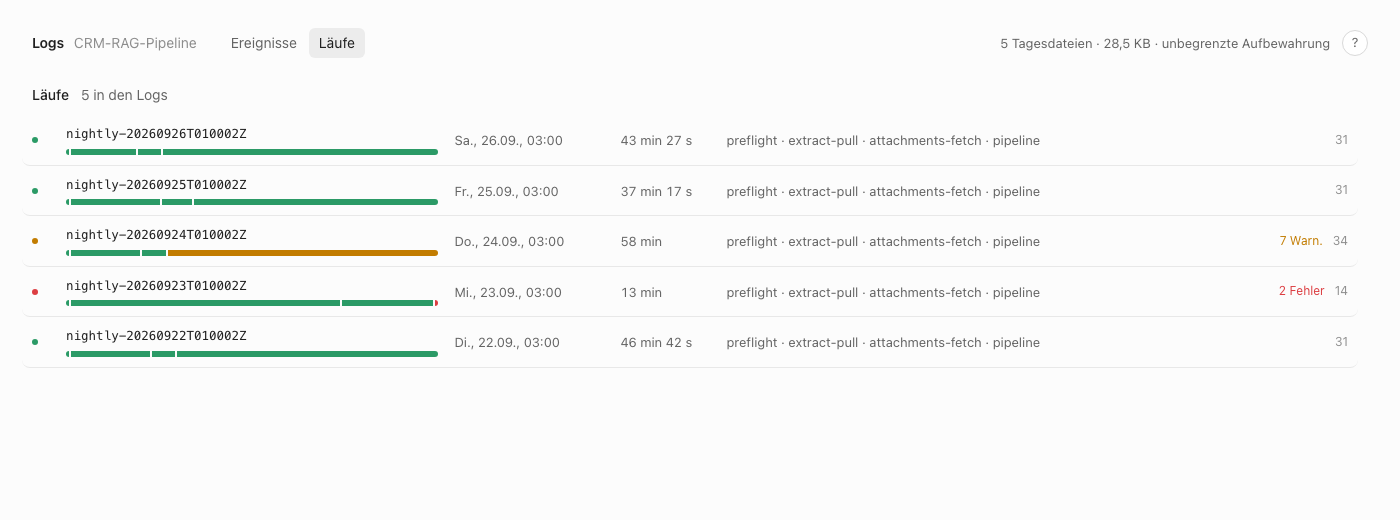
The runs tab groups every event by its run id and gives each run a status. The
verdict comes first from the run's status.json, which the nightly script now
writes on every way out, including a refusal and a stage killed by its time
limit, because the runs that most need a verdict are the ones that end early.
Exit code 0 is green, 1 means it carried on with something degraded, anything
else is red. A run with no verdict yet and a line in the last fifteen minutes
counts as still running.
The events tab is the raw stream, newest first, with filters for time, level,
run, pipeline step, logger and program, each showing how many events it would
leave. The search takes plain words, "exact phrases", -exclusions, and
field:value for any logged field, like code:2 or a ticket number.
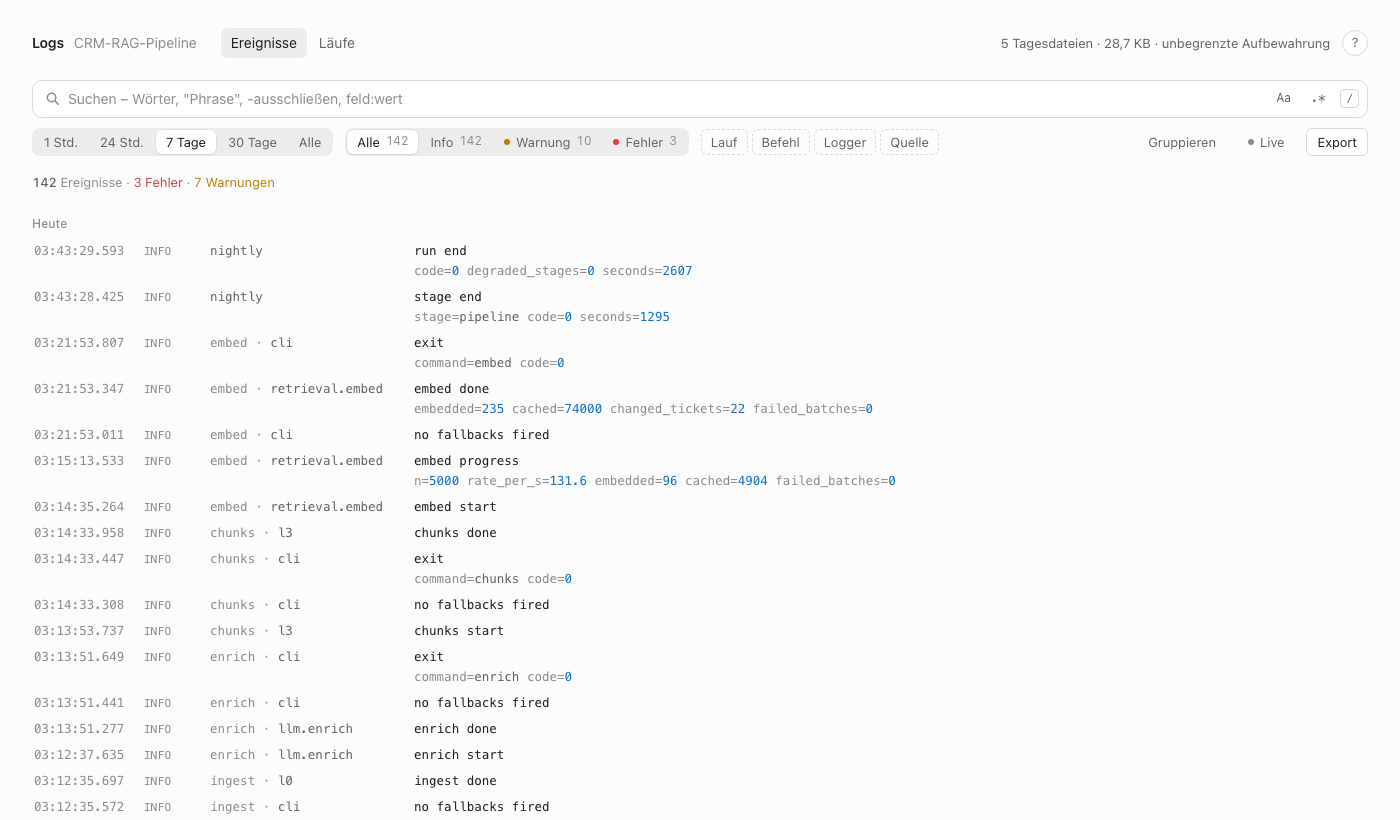
The interface is in German, because the people who'll open it at the customer
are. It has keyboard shortcuts for the person who opens it every morning,
/ to search, e for the next problem, c for the lines the same process
wrote around an event. And it exports whatever you've filtered as a file, for
the day someone needs to send it to me.
Step four: the night it would have shown
Here's the refused night from the nightly article, as the viewer shows it.
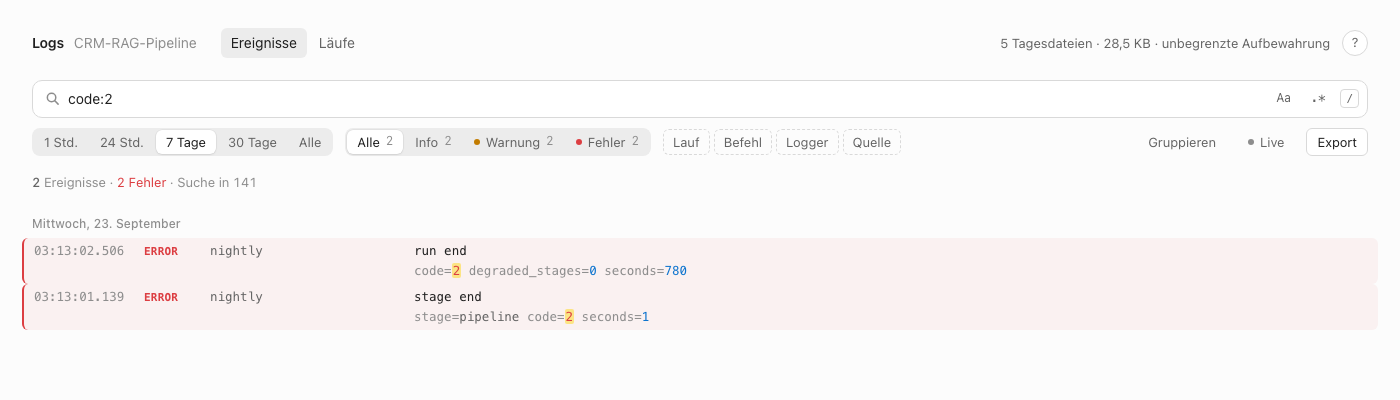
A search for code:2 finds the pipeline stage ending with exit code 2 after
one second, and the run ending with it. That's the what. Opening the run
shows the why:
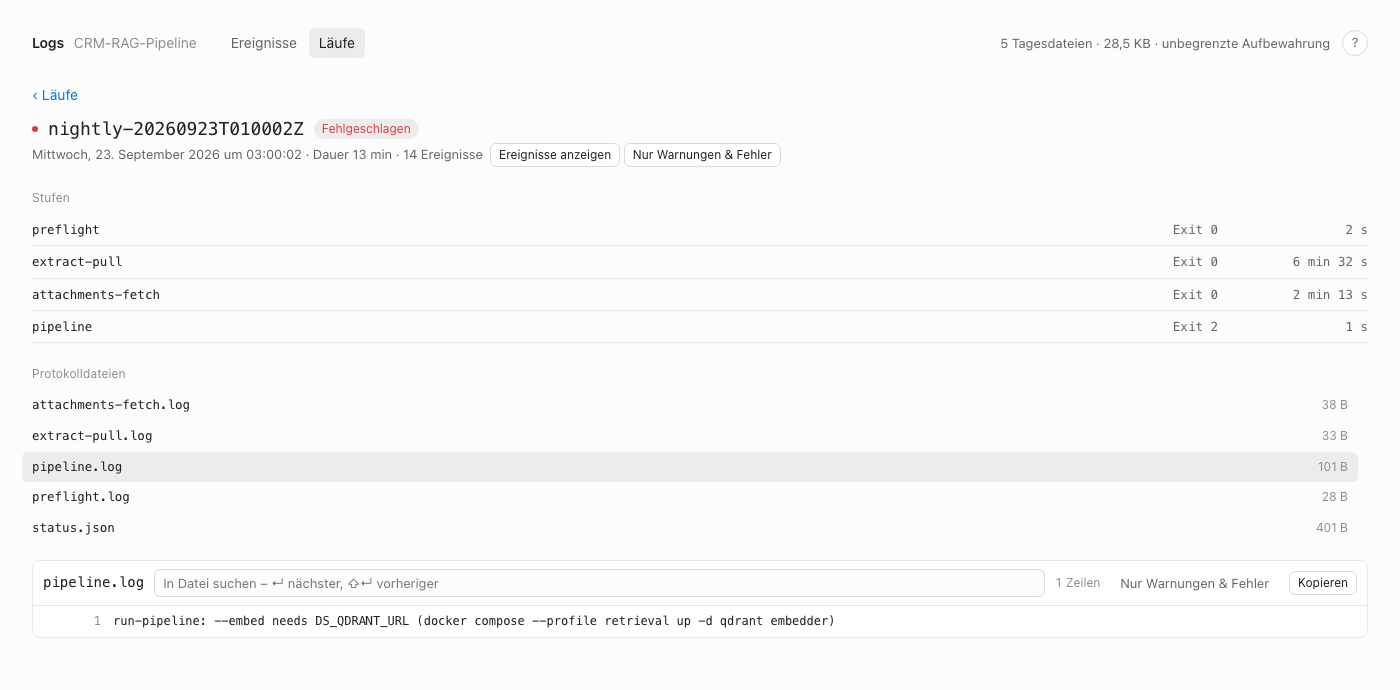
The stage's own log file holds the wrapper script's refusal:
--embed needs DS_QDRANT_URL. The address cron never passed. With this tool that's two clicks on the first morning. Without it, the refusal
went unnoticed night after night.
And it shows a gap I'd rather name than hide. The reason is only in that file. The nightly script writes an event when it refuses, but the wrapper script's refusal just prints a line and exits, so it never becomes an event, and a search across all runs can't find it. The fix is one line in that script, and it isn't in yet.
What it deliberately isn't
It isn't monitoring. Nothing in it alerts anyone. It answers questions for a person who comes to ask them, and the status file it reads is also what a real monitoring check could read. That check is written down and not built, same as the one for the central portal.
It isn't the central log portal either, and it doesn't try to replace it. The portal holds what the containers say. This holds what the job says. They answer different questions, for two very different kinds of reader.
And it isn't merged yet. It's on a working branch of the pipeline repository, with thirty tests of its own.
What I'd take from it
Group by the thing people ask about. Nobody asks about lines. They ask about last night.
A name that can't collide beats a lock that has to be right. Naming the file by its date removed a whole class of multi-process bugs without a single line of coordination.
And for a machine nobody watches, build the reading tool as seriously as the writing. Every earlier fix in this series wrote better logs. This is the first one that made anyone likely to read them.
Written with AI from my own repositories and notes, reviewed and published by me. How this site is written